Correction of position data in 3D visualization
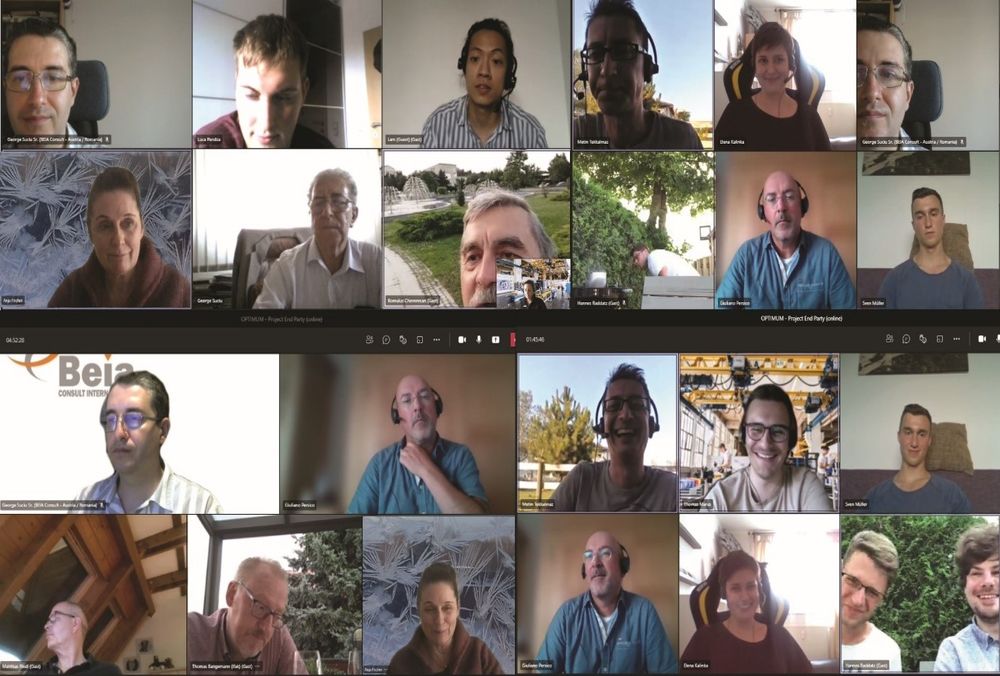
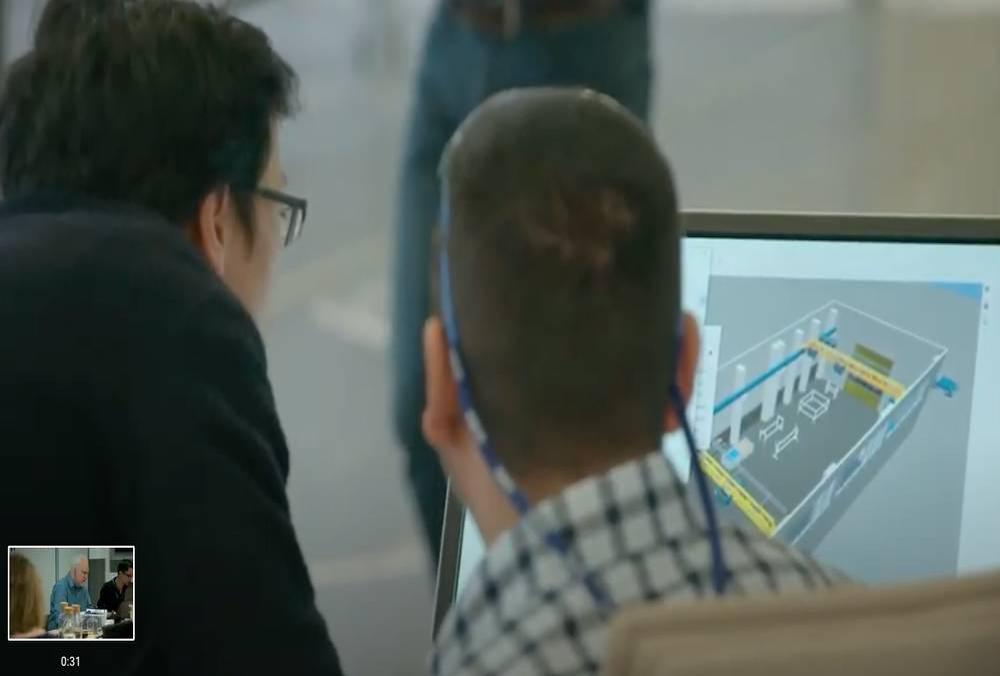
On Thursday, February 4, 2021, another remote workshop was held for the OPTIMUM project. This was scheduled as a follow-up to the last workshop on January 27 (visualization of the current positions of cranes and Automated Guided Vehicle (AGV) in taraVRcontrol). There, the goal was already achieved to obtain the position data of the cranes and the AGV in the visualization tool taraVRcontrol and to display the positions.
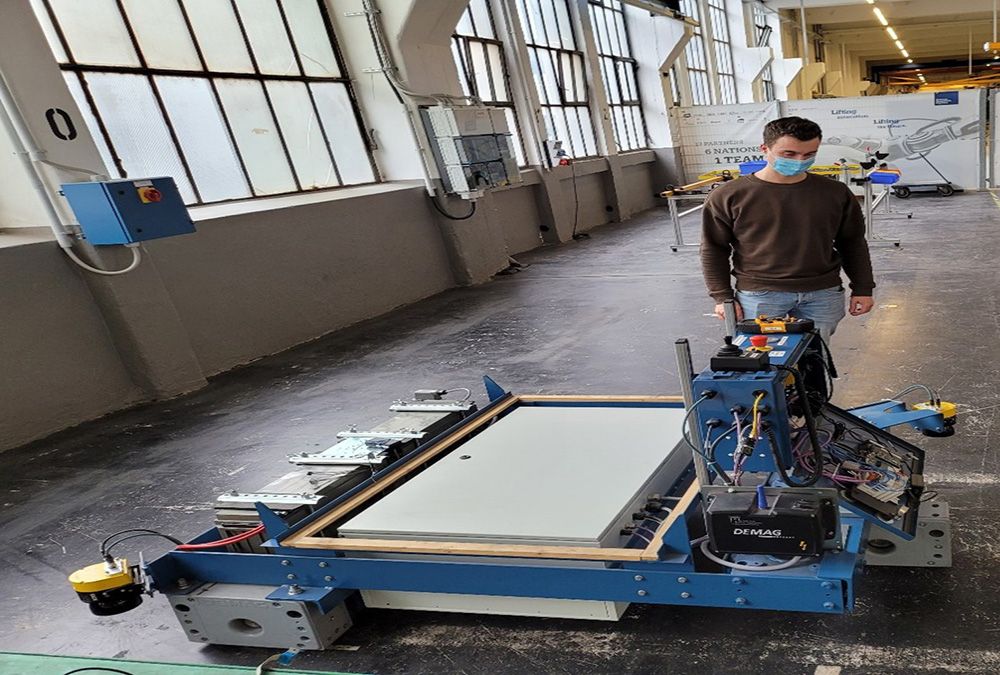
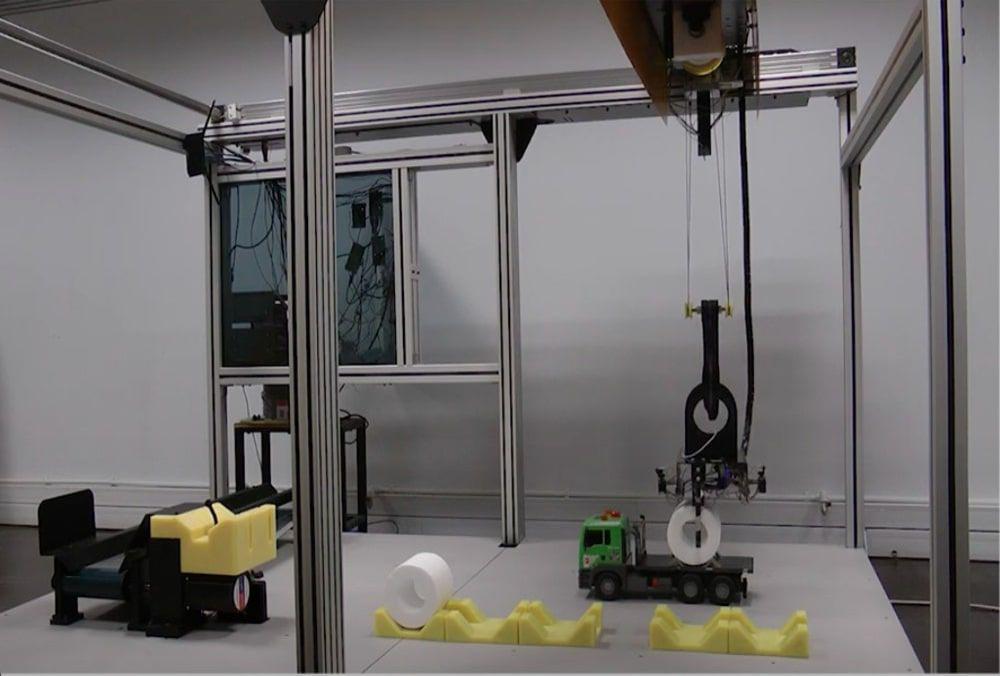
The location data of machines within the production hall is determined with the help of position detection via ultra-wideband technology from COMNOVO. For this purpose, anchor modules were mounted on the ceiling and walls to determine the distance to moving sensors (for example, on the hook). The position data determined by COMNOVO then flow into the digital twin and enable its visualisation by taraVRcontrol.
In the first workshop on 27 January 2021, the position data could be updated within the DEMAG Research Factory and the visualisation implemented. However, during this workshop on 4 February 2021, the determined position data had to be revised and adjusted again. In the process, different factors and offsets were used, which enabled an adjustment through a simple multiplication with the already available position data.
Finally, the team was able to display the position correctly in taraVRcontrol and thus successfully completed the workshop.
